

Features
Admin panel
The side your team works in: insights, users, abuse monitoring, statistics, the energy report, the audit log, the status page, bulk operations and, on VMware only, migration.
On this page
Overview and insights
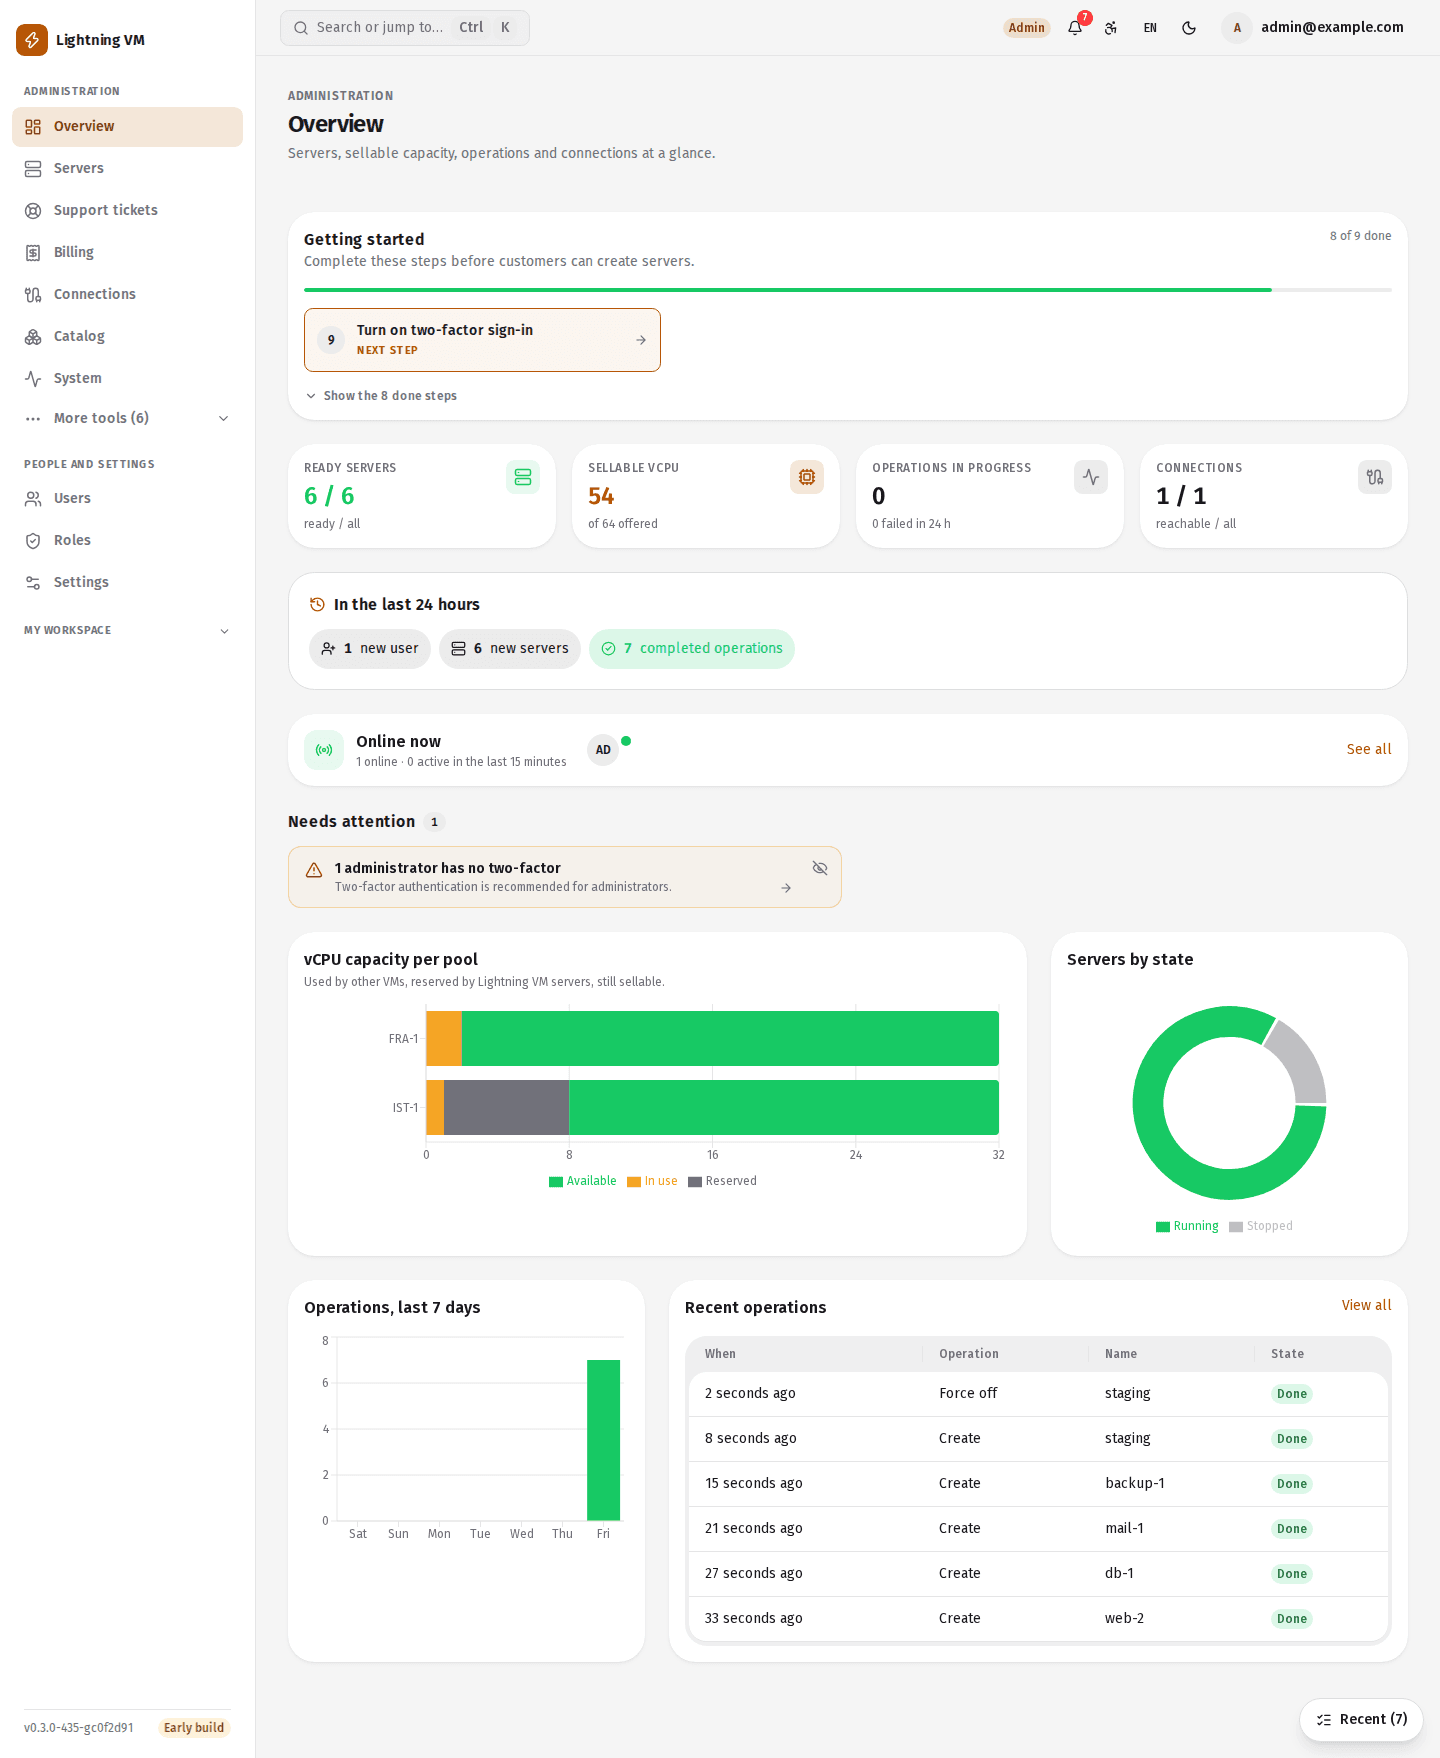
The overview sums up what is new since you last looked: users, servers, failed operations, abuse findings, alerts, and refused or failed sign-ins. Insights list pools forecast to fill up, IPs running low, idle, oversized or undersized servers, stuck jobs, payments awaiting review, a restore hold, and operations whose outcome is unclear and waits for a decision.
Three menu entries carry a counter: Billing (payments awaiting review), Servers (operations failed in the last 24 hours) and Abuse (findings nobody has acknowledged yet).
Users
A user's detail page has verifications, the password, resetting two-factor authentication, passkeys, linked accounts, sessions and the sign-in history. A user can be banned, signed in as, and given a team note. For roles and role limits see Security and identity.
Adopting existing VMs
A VM created outside the panel becomes a customer's server while it keeps running. Adoption and the consistency check exist on all seven platforms.
Migration and host evacuation
On VMware only: you can move a running server to another host or datastore, and move every server off a host before maintenance.
Abuse monitoring
- Port scan: a TCP connection to risky ports is attempted on the IPv4 addresses of every ready server (the default list: Telnet, SMB, MS SQL, Docker API, MySQL, PostgreSQL, Redis, Elasticsearch, Memcached, MongoDB). By default the scan runs every 30 minutes. When the port closes, the finding closes by itself.
- Suspected mining: a finding is opened when at least 90% of the samples in a window (6 hours by default) are above the CPU threshold. The docs call this a sign, not proof.
Only ports visible from the panel's network are scanned. Suspected mining works on the platforms where CPU is measured.
Statistics and the energy report
Statistics show indicators with their trend against the previous period, time series, breakdowns by location, operating system and package, the largest customers, and a day-by-hour map of operations.
The energy report gives kWh, cost and an estimate of carbon. If the host reports its power meter, the value is recorded as measured; if not, it is estimated from CPU use (the default profile is 120–400 W). A host's power is shared out among its servers in proportion to their CPU use; this is an estimate.
Topology
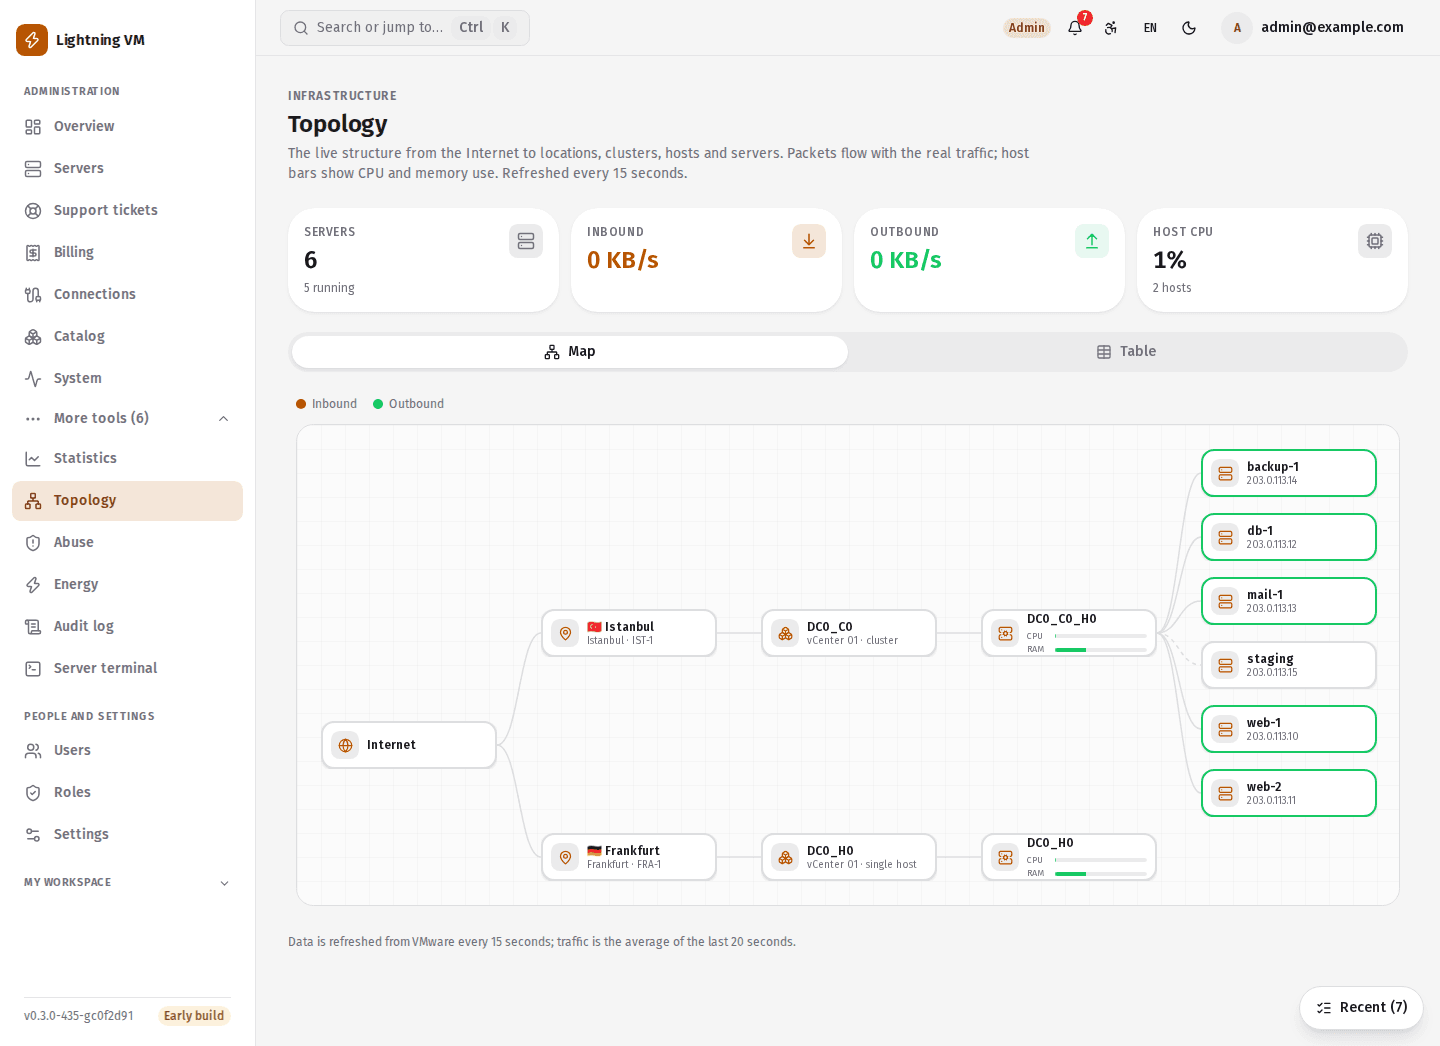
The topology view is in the admin panel; the customer side has a view of the virtual datacenter and of the network topology as well.
Audit log, announcements and the status page
- The audit log records what was done; its filter and sort order can be kept as a saved view.
- An announcement banner shows announcements to users.
- A public status page (
/status) shows the state of the panel's parts and of the locations; an admin opens incidents and writes updates.
Bulk operations and saved views
Under Administration → Servers you apply a bulk operation to the servers you tick at the start of their rows or, if you say so explicitly, to everything the filter shows; 200 servers at a time at most. In the Servers, Users, Support queue and Audit log lists, and in the invoice and payment lists, a filter and sort order can be saved under a name (12 per list at most).
The panel's own server
- Server state: live CPU, memory, load and disk graphs of the server the panel runs on; services, file systems, the processes using the most resources, and the logs of each service. Only admins see the logs.
- Operating-system updates: installing security updates or all updates on the panel's server, automatic security updates, and restart. Debian / Ubuntu (apt) only.
- Server terminal: for admins, with two-factor authentication required.
- This server: the hostname, time zone, NTP servers and DNS servers are changed from the panel.
For updates and backups see Install, update and backup.
Source: docs/operations-modules.md (Turkish).
Install command
curl -fsSL https://lightningvm.app/install.sh | sudo shUbuntu 22.04 / 24.04 / 26.04. Requirements and options